Network management
Day-to-day network operations in Swift Fox: the network status page, access point pinglogs, the frequency planner, automatic firmware upgrades, config backups, and interface bandwidth graphs.
Network Status Page
The network map is the hub for all network monitoring functions in Swift Fox. It allows you to get a thorough understanding of the entire network’s performance at one glance.
- The network map is reachable by clicking Network in the left sidebar menu.
- The main page shows all of your network sites, as well as the connections between them. They will be colour coded to show the status of each site. If they are all grey, that means that your pingbox is not running or is having issues. Black means hard down (no response whatsoever), yellow and orange mean high packet loss or latency, and bright green means low latency and no packet loss (a perfect connection). The colours for sites are based on the average of the devices and customers at that site.
- You may see a triangle with a number in it overlaid on a site. A red triangle means infrastructure devices are down, and a yellow triangle means they have other issues — the number represents the number of devices at that site that are affected and clicking it will show details on the issues discovered.
- Below the network map will be a list of all the sites, with their “Pinglogs”. Pinglogs show the same info as you see in real-time for the sites, but over the past 24 hours. This allows you to see if a site had problems overnight, or if a few sites had problems at once. You can select different time periods from the dropdown to get an idea of a site’s performance in the last hour, or even the last year.
- Between the map and the pinglogs on the status page will be a list of any issues that are detected on the network. These will be things like customers and infrastructure devices that are down, devices that Swift Fox is unable to automatically log into (either because they are unreachable or because the login is invalid), as well as IP conflicts, customers without billing packages, and other issues. Clicking any of these will show the details.
- At any time you can resize the bottom bar so that you can see more at once, or if you make your browser window wide enough (and your screen resolution is large enough to support this), it will appear beside the map instead of below.
Access Point Pinglogs
The place that you will likely spend the most time troubleshooting network issues is the pinglogs of specific access points. You can find these by clicking on a specific site on the network map (open Network in the left sidebar), and then clicking on a specific access point.
- Access points appear different from other infrastructure devices at a site, in that they also show a small white box with smaller colours representing each customer on the site. This is all updated in real-time, with infrastructure devices being tested once every 20 seconds and customers every 60 seconds.
- The box for an access point on the netmap will be coloured based on the average of all customers on it, except for a triangle in the top-left which represents the connection to the AP itself (i.e. over the ethernet).
- When you click on an access point from a site, it will show all of the associated customers in the bar below. By default, they will be sorted by signal strength, from worst to best. You can also choose to show and sort by MAC address, bandwidth used so far this month, or by ACK timeout (distance from tower). Resize the bottom bar to see the whole list at once, it makes this much easier.
- Clicking on the customer name here will take you to the customer page, where you can do a real-time connection test or see their full pinglog history. You can also click the IP address here which will open a new window directly to the web interface of their customer radio.
Some things to watch for on AP pinglogs are sudden changes in the colour of pinglogs (‘vertical stripes’), which affect all customers. Often this can mean noise was suddenly introduced on a channel, and a frequency change may resolve it. If the colour slowly creeps from bright green to dark green, to yellow and then orange/red — and it affects clients with lower signal worse — it could mean that the sector is over-capacity, and either a channel change will help or adding another sector and splitting the clients between them.
Frequency Planner
Once you have a large number of access points and backhauls on a single tower site, it can be cumbersome to keep track of all the frequencies that are assigned to the devices. This means that when there’s noise and you need to shuffle them around, you may be more prone to accidentally using the same channel. Swift Fox has a tool to prevent this problem.
- On the network map, open a site and click the Frequencies tab in the details pane.
- This will show a chart with the frequency bands along the top, and the devices assigned to each band in boxes below, with each row correspodning to a separate site. By default it will only show sites that have backhauls to the selected site, but if you switch to the netmap “Map” view (button in the top-right corner), it will show all sites that are within the map pane view.
- The key for frequency coordination is to try to avoid situations where radios that are pointing at eachother are sharing the same frequency, which will show up as two frequencies algined vertically on the map. It’s especially important to avoid two radios using the same channel on the same tower (except in cases of full duplex links or GPS coordination)
- Frequencies will show in orange if they are outside the bands that you have configured for your network (this may indicate that they are not in legal bands for your area), and they will show in cyan or purple if they are full duplex channels (RX and TX respectively). Blue frequencies are the default half-duplex ones.
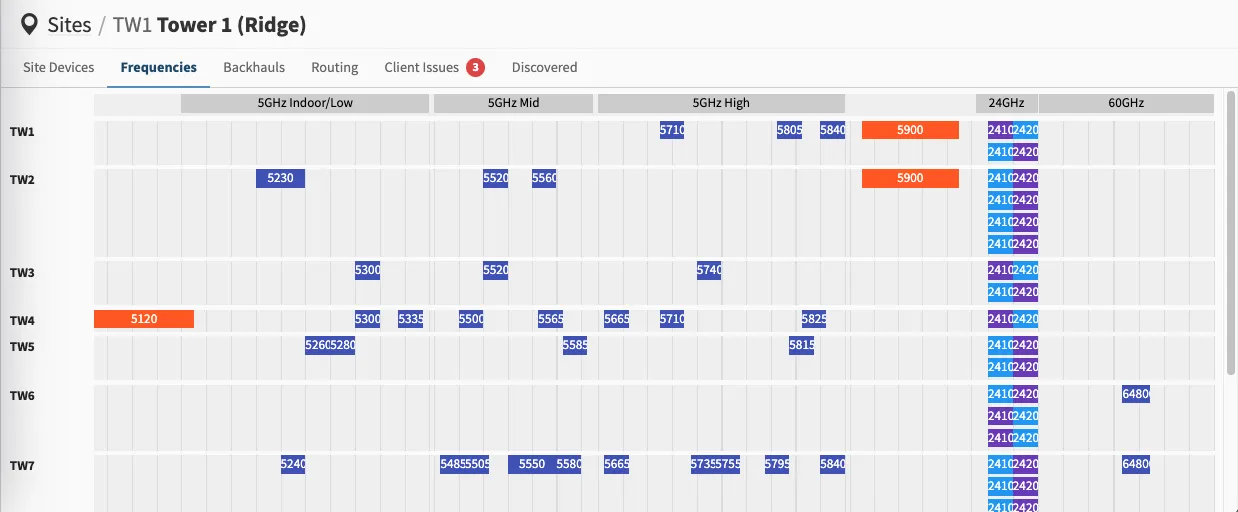
The frequency planner: channel assignments across bands, with conflicts highlighted.
Automatic Firmware Upgrades
Currently only supported for Ubiquiti CPEs, Swift Fox will automatically push new firmwares to all client devices late at night in order to keep the radios up-to-date and reduce security vulnerabilities.
- Go to the Automatic Firmware Updates page under Network → Settings.
- Take a look at the firmware variants that are supported. The variant type is based on the first couple letters of the firmware file, and each one represents a type of radio.
- Download the latest firmware that you wish to deploy from the Ubiquiti site, and upload the correct variant to each row in Swift Fox.
- Before you set this to start, you will want to upgrade a handful of radios of each type across your network just to be sure that this version does not introduce any show-stopping bugs.
- When you’re ready, set the “Update a maximum of ___ CPEs” box to a reasonable number. If it’s a firmware that you trust and you want everyone to be upgraded at once one night, set this high — like 500. If you are skeptical of a firmware and you want to roll it out slowly, set it to something like 10 or 20 — and Swift Fox will only upgrade that many each night.
- Make sure that all the access points that you want to enable upgrades for have the “CPE Upgrades Enabled” checkbox set in the Edit Device menu on the network map (open Network in the left sidebar).
Config Backups
Swift Fox will automatically back up the config of all Ubiquiti, MikroTik, and Cambium infrastructure on the network. These are saved historically, so that you can go back and see when a change was made or what a setting was before it was changed.
- Open the network map (Network in the left sidebar) and click into a site.
- Find the device you want and either right click it and select “View Config Backups” or click the “Configs” tab on the device pane.
- On the left you should see a list of every time the config was changed for this device. It will only show a maximum of two config changes per day, so if more were made than that — they may get skipped.
- If you need to restore a device to a config, for instance if a tower was hit by lightning and all the radios were blown — simply select a single device, then click the “Download” button above the config. For Ubiquiti, this will be the config file that you can upload directly to the radio. For MikroTik, it will be an “export compact” that you can paste into the terminal of a new device that has had its default config removed.
- If you select two backups, you can see the compare the differences between them side by side to see what has changed.
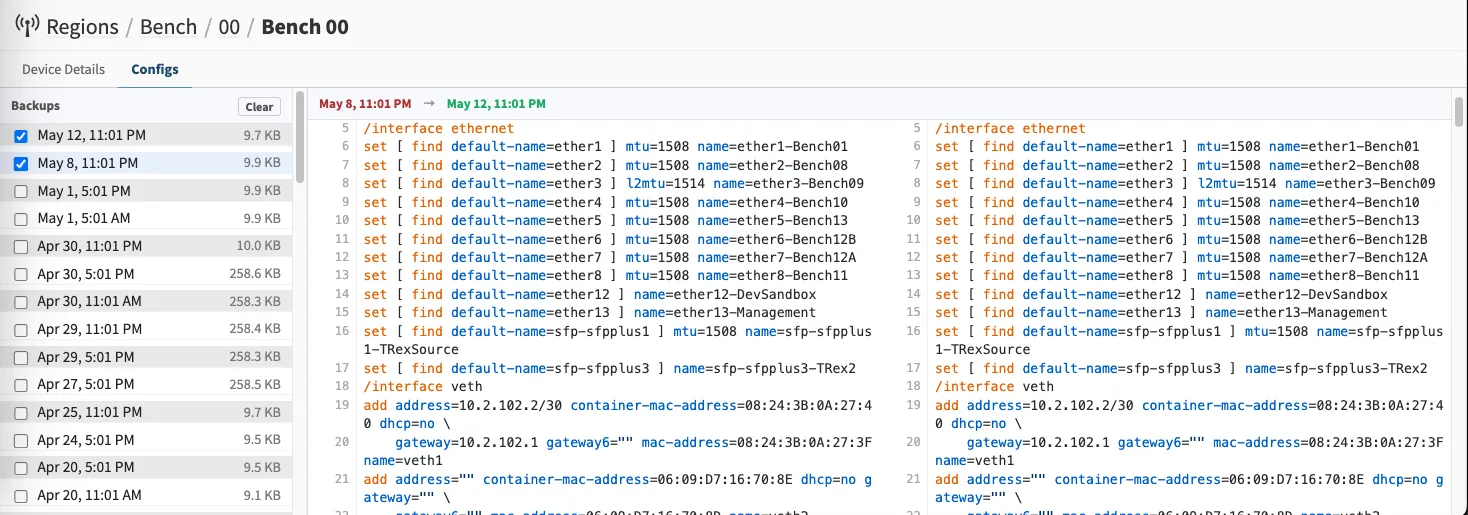
Config backup history with a diff between two versions.
Interface Bandwidth
For some supported models of devices, Swift Fox will gather the interface counters and keep a graph history of the total throughput on each interface. This can be useful in determining whether a link is over-capacity by looking for “flat tops” at prime time.
- Open the network map (Network in the left sidebar) and click into a site.
- Find the device you want and either right click it, and select “View Interface Bandwidth” or if you are mobile, tap the device and select the same from the “Device Actions” menu.
- Graphs for Daily, Weekly, Monthly and Yearly traffic for each interface on the device will be shown. The interfaces are the internal names for the devices, but generally anything with “eth” will be Ethernet and “ath” or “wlan” will be wireless.